Tool Breakdown
Foot Traffic Data Is an Estimate. Price It Accordingly.
Panel-based location data is the most retail-specific tool in the category and the most widely misread. Here is what it is actually measuring, and when it changes a decision you would not otherwise have made.
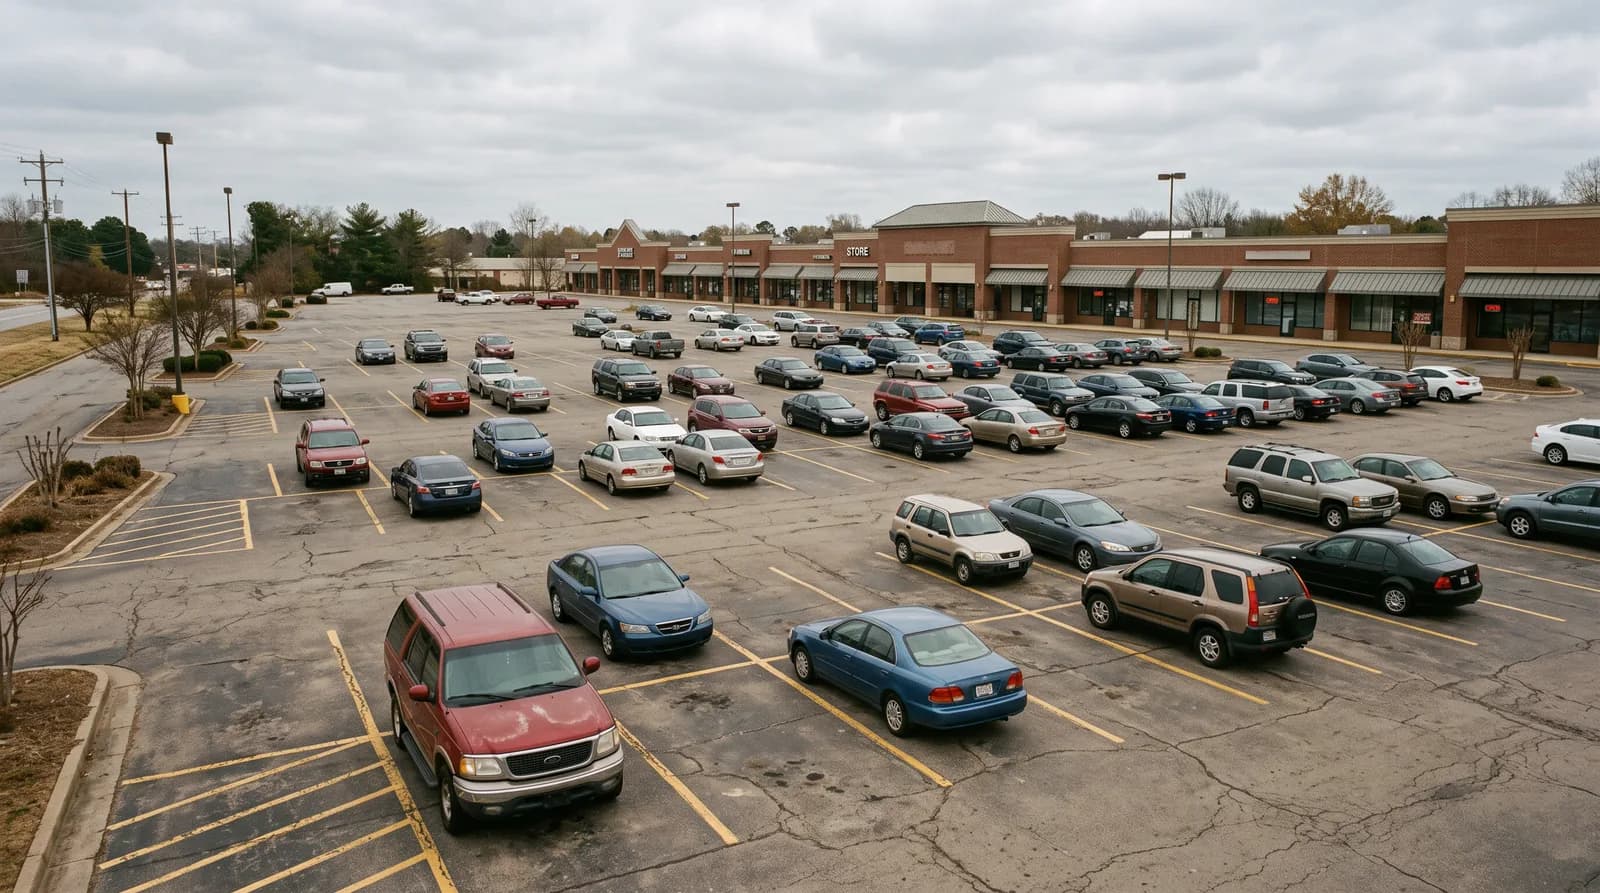
Foot traffic data is the most genuinely retail-specific category in commercial real estate AI. It is also the one where the gap between what the product measures and what buyers believe it measures is widest.
Start with what it is, in the vendor's own words. Placer describes mobile location data forming a panel that "serves as the basis for larger estimations," with controls for panel volume, modeled panel biases, and normalization as the underlying app and device mix changes over time.
Read that sentence carefully, because it is accurate and it is doing a lot of work.
What panel extrapolation actually means
Nobody counts every visitor. A subset of phones in a market are observable through app-based location permissions. That subset is the panel. The panel is then scaled up to estimate total visits, with adjustments for known biases in who is in the panel and how that composition shifts.
This is a legitimate, standard methodology. Television ratings work this way. Political polling works this way. It produces useful numbers.
It also produces numbers with specific and predictable weaknesses:
Relative beats absolute. Panel extrapolation is far more reliable comparing a location to itself over time, or to a similar location in the same market, than at stating an absolute visit count. "This center's traffic is up 12% year over year" is a stronger claim than "this center received 412,000 visits."
Small denominators get noisy. A regional mall has a large observable sample. A four-tenant strip center on a county road does not. The methodology is identical; the confidence is not. This is the single most important thing for a small-portfolio owner to understand, because your assets are more likely to sit in the noisy end.
Panel composition is demographic. Who opts into location-sharing apps is not a random sample of the population, and it skews by age, income, and geography. Vendors model this. Modeling reduces bias; it does not eliminate it.
Attribution at close range is hard. Distinguishing a visitor to your center from someone at the adjacent parcel, or someone parked at the shared entrance, is a resolution problem. It matters most in dense retail corridors, which is where a lot of retail sits.
Practitioners argue publicly about accuracy, sometimes heatedly. We are not going to adjudicate that with a forum thread, and neither should you. What is defensible from the primary source is narrower and more useful: this is an estimate produced by extrapolating a panel, the vendor says so plainly, and estimates have error bars that get wider as the sample gets thinner.
What it costs
Neither of the two best-known products in this category publishes a price. Placer's pricing page is titled "Pricing That's Tailored For Your Needs" and routes to a conversation. Buxton runs an enterprise engagement model.
That tells you the buyer profile. This is a category sold to owners with portfolios, retailers with expansion programs, and brokerages, on negotiated annual contracts. It is not built to be bought by someone with six centers, which is not a criticism of the products, only of the fit.
When the data actually changes a decision
The honest test for any data purchase is not "is this interesting." It is "would I have decided differently."
It changes a decision when:
- You are pitching a tenant. A prospective tenant's real estate committee already subscribes to this data. Showing up with the same numbers, framed for your center, puts you in the conversation on their terms. This is the strongest use case for a small owner and it is a sales use, not an analysis use.
- You are choosing between two acquisitions. Relative comparison across candidate assets in the same market is what the methodology is best at.
- You are testing whether something worked. A repositioning, a new anchor, a changed access point. Before-and-after on the same location is the highest-confidence read the data offers.
- You are contesting a co-tenancy or renewal argument. A tenant claiming traffic collapsed is making an empirical claim. Data that says otherwise is worth having.
It does not change a decision when:
- You already know the answer. Most owners know their own centers' rhythms better than an extrapolation does. Paying to confirm intuition is a common and expensive habit.
- You are looking at a single small asset in isolation. The confidence is weakest exactly here.
- You need an absolute number for underwriting. Treating an extrapolated visit count as a hard input to a pro forma imports error you cannot see into a model you will defend to a lender.
The cheaper alternatives, honestly assessed
For an owner not writing an enterprise check, the realistic stack is worse than the paid product and often sufficient:
- Your own tenants' sales reports. If you have percentage rent tenants, you already receive a sales signal that is closer to what you actually care about than visit counts are. It is under-used because it arrives as email attachments rather than as a dashboard.
- Public mapping platform popular-times data. Free, coarse, panel-based in the same way, and adequate for relative patterns like day-of-week and hour-of-day.
- Census and county parcel data. Free, authoritative for demographics and trade-area composition, useless for visits.
- Counting. Genuinely. A camera or a manual count on a few representative days gives you a ground truth for your own asset that no panel can, and it is the only way to sanity-check anything else.
That last one is not a joke. If you are considering a five-figure annual subscription, spending one weekend establishing what your actual traffic looks like is a rational first step, and it gives you a reference point to evaluate any vendor demo against.
The summary
Foot traffic data is real, useful, and an estimate. Its best applications for a small retail owner are comparative and persuasive rather than absolute and analytical: proving a trend, winning a tenant conversation, comparing two candidates.
Buy it when you are about to make a decision that the data could actually flip, and price the subscription against that decision rather than against the dashboard. If the honest answer is that you would proceed the same way either way, you are buying reassurance, and reassurance is available cheaper.
Sources
- 1Placer.ai, 'Foot Traffic Data & Analytics' — the company's own description of its methodology: mobile location data forming a panel that 'serves as the basis for larger estimations,' with stated controls for panel volume, modeled panel biases, and normalization of panel variation over time. https://www.placer.ai/foot-traffic-analytics
- 2Placer.ai pricing page — 'Pricing That's Tailored For Your Needs.' No public price or tier structure is published; pricing is quote-based. https://www.placer.ai/pricing
- 3Buxton — retail customer analytics and site analytics; enterprise engagement model. https://www.buxtonco.com
- 4r/CommercialRealEstate discussion thread disputing foot traffic accuracy, August 2024. Cited as evidence that practitioners publicly disagree about accuracy, not as a measurement of accuracy. Anonymous forum anecdote is not data. https://www.reddit.com/r/CommercialRealEstate/comments/1exrxwp/wildly_inaccurate_foot_traffic_data_from/
- 5Pricing and packaging observations for comparable tools drawn from the public pages of vendors tracked in our own database, snapshotted 2026-07-26.
- 6Disclosure: Woodworks Realty Studio advises retail owners on tool selection, including tools in this category. We have not verified any foot traffic product hands-on, and this piece is a category analysis rather than a product verdict.
Keep reading
Work With Us
Your team already has AI. Almost nobody uses it.
The licences are bought and the accounts are open, and most of them sit in a tab nobody opens on a Tuesday. Woodworks Realty Studio gets an assistant into the hands of every person on a team, one at a time, each one set up around how that person actually works. My own business runs on it before any of it reaches anyone else.